Console — Explore
Explore view of the Console (http://localhost:8093 in Development). The canvas (browser graph library) paints a recalculated snapshot of the live store: it is not a persistent graph. Each request to the console telemetry backend rebuilds nodes and edges.
Related: Console — Operate index · Knowledge layers.
What it is and is not
| It is | It is not |
|---|---|
| Live operational graph (hosts, agents, tasks, chats, RAG, skills…) | Ontology catalog (Ontology → separate tab) |
| Recalculated snapshot on every refresh | Code graph (compiled repository graph artifact) |
Operations panel for admins with institution:read | Client RDF/SHACL catalog |
The live-graph vocabulary is closed. CI runs tools/check_vocabulario_del_grafo.py and tools/check_shacl.py (pyshacl, inference=none). An emitted undeclared type fails the pipeline.
Prerequisites
| Requirement | Check | If it fails |
|---|---|---|
| Main stack | curl -sf http://localhost:8093/healthz → 200 | make up |
| OIDC auth | Open http://localhost:8093 (localhost, not 127.0.0.1) | Redirect URI in identity provider |
| Role / scope | You see Explore on top and the graph loads (no 401 banner) | Role with institution:read |
| Institution with data | Canvas counters > 0 (e.g. provisioned demo institution) | Catalog + Provisioning |
Snapshot backend: console telemetry (:8091), proxied via Console at /api/telemetry/….
Enter Explore
- Open
http://localhost:8093and authenticate with OIDC (Sign in if the landing asks). - At the top, between Ontology and Operate, click Explore.
- (Optional) ES / EN top-right — EN screenshots are published under
/img/operar/en/when available.
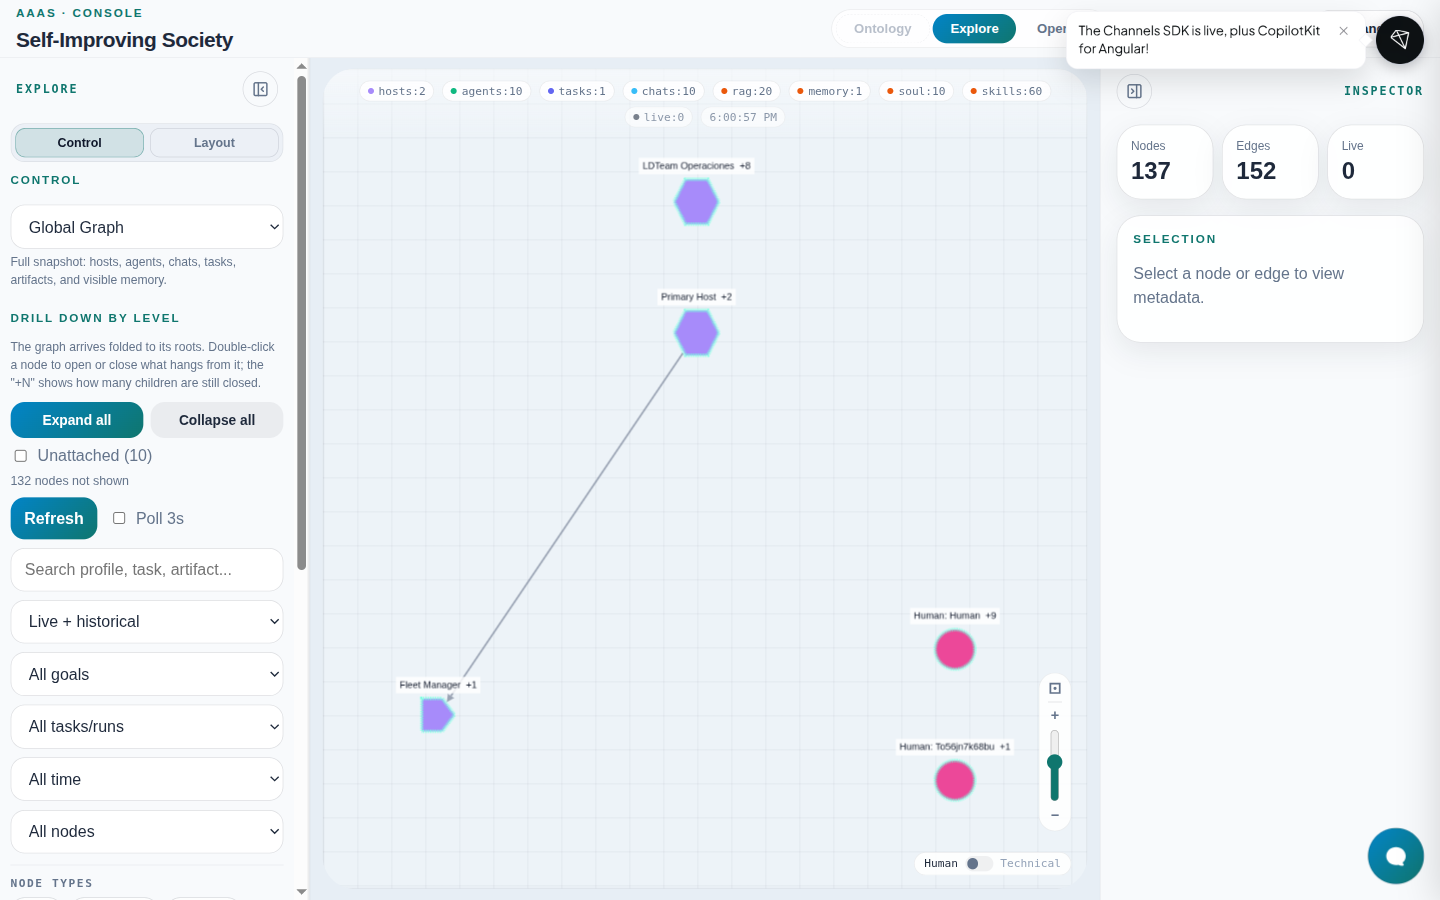
The canvas top bar summarizes counts by family (hosts, agents, tasks, chats, rag, …) and the last snapshot time.
Left panel — Control tab
Graph view selector
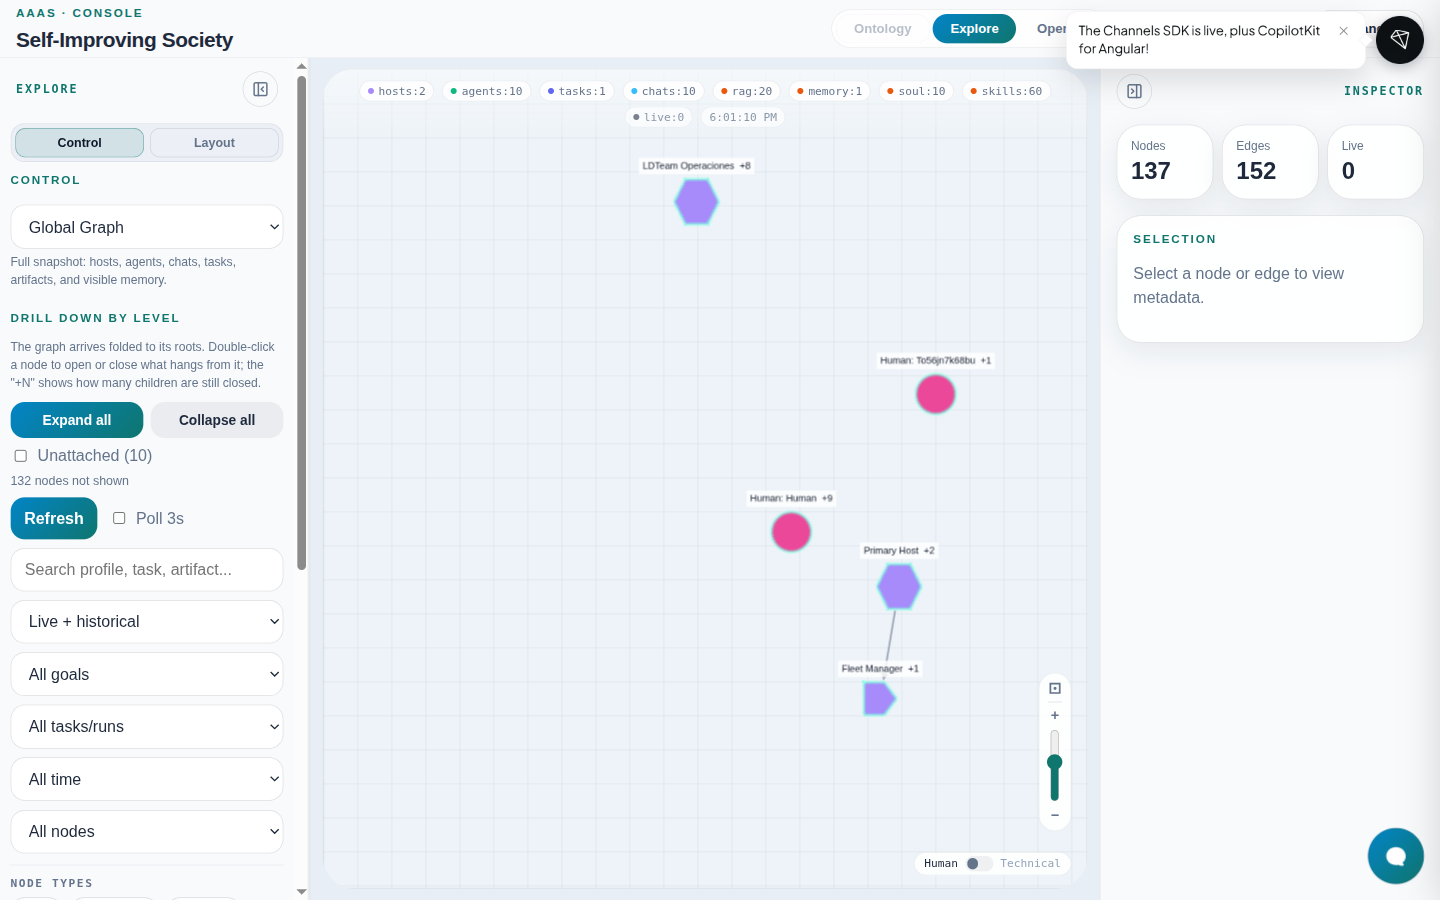
The Global Graph dropdown changes the snapshot slice (GRAPH_VIEW_OPTIONS):
| Internal value | UI label | What it shows |
|---|---|---|
global | Global Graph | Full snapshot: hosts, agents, chats, tasks, artifacts, visible memory |
runtime | Runtime Graph | Execution canvas: chats, goals, tasks, runs, artifacts, connected participants |
inventory | Society Inventory | Society at rest: hosts, agents, RAG, sessions, base capabilities |
agent-knowledge | Agent Knowledge | Per-profile identity/knowledge; excludes chat threads |
society-knowledge | Society Knowledge | Sanitized society-wide knowledge graph |
chat-threads | Chat Threads | Conversations, turns, humans, agents, goal candidates |
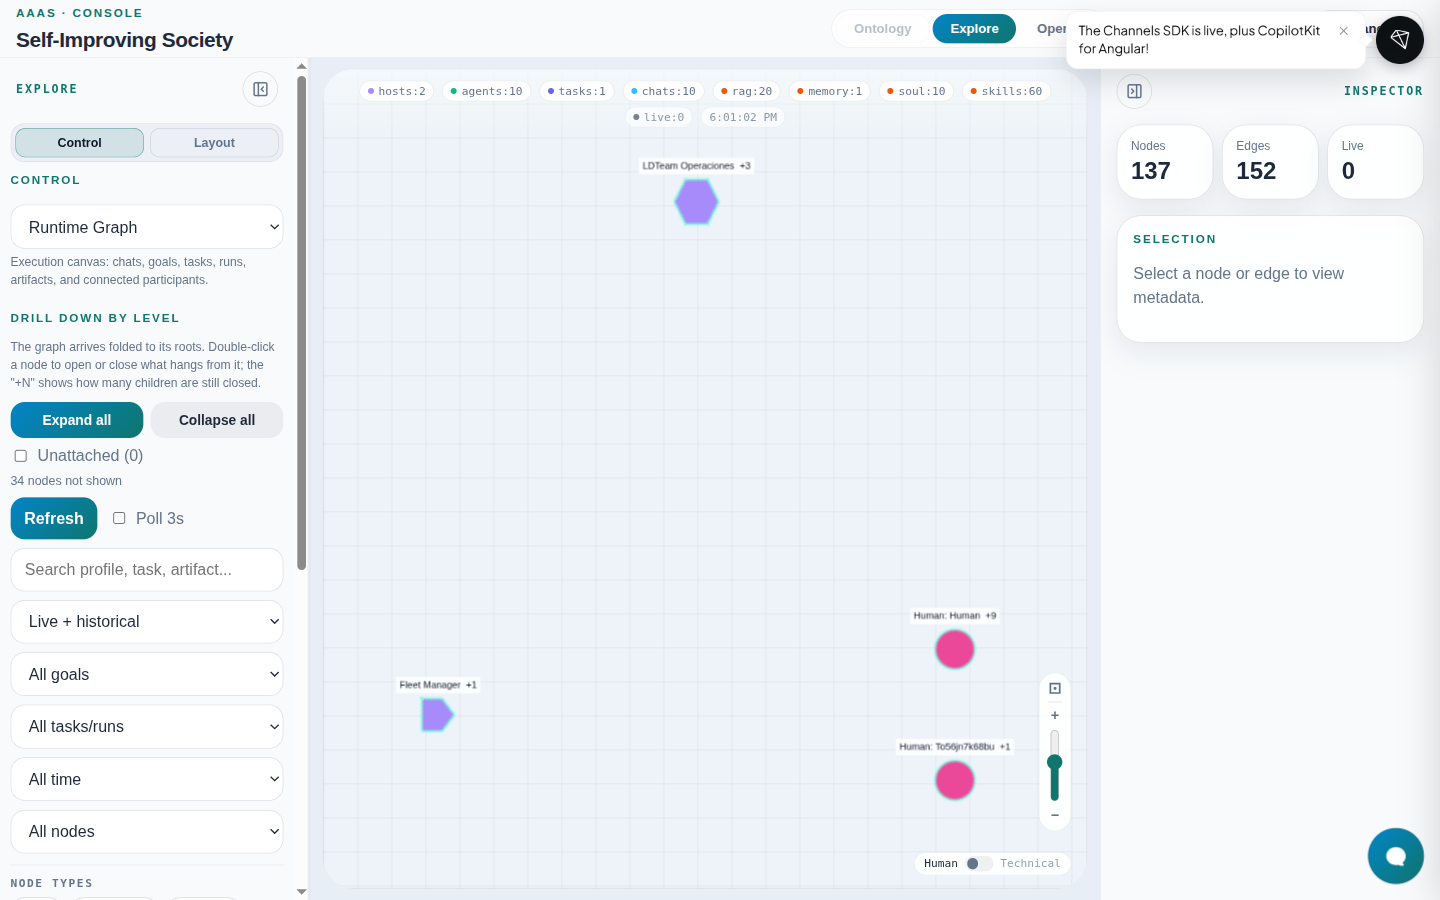
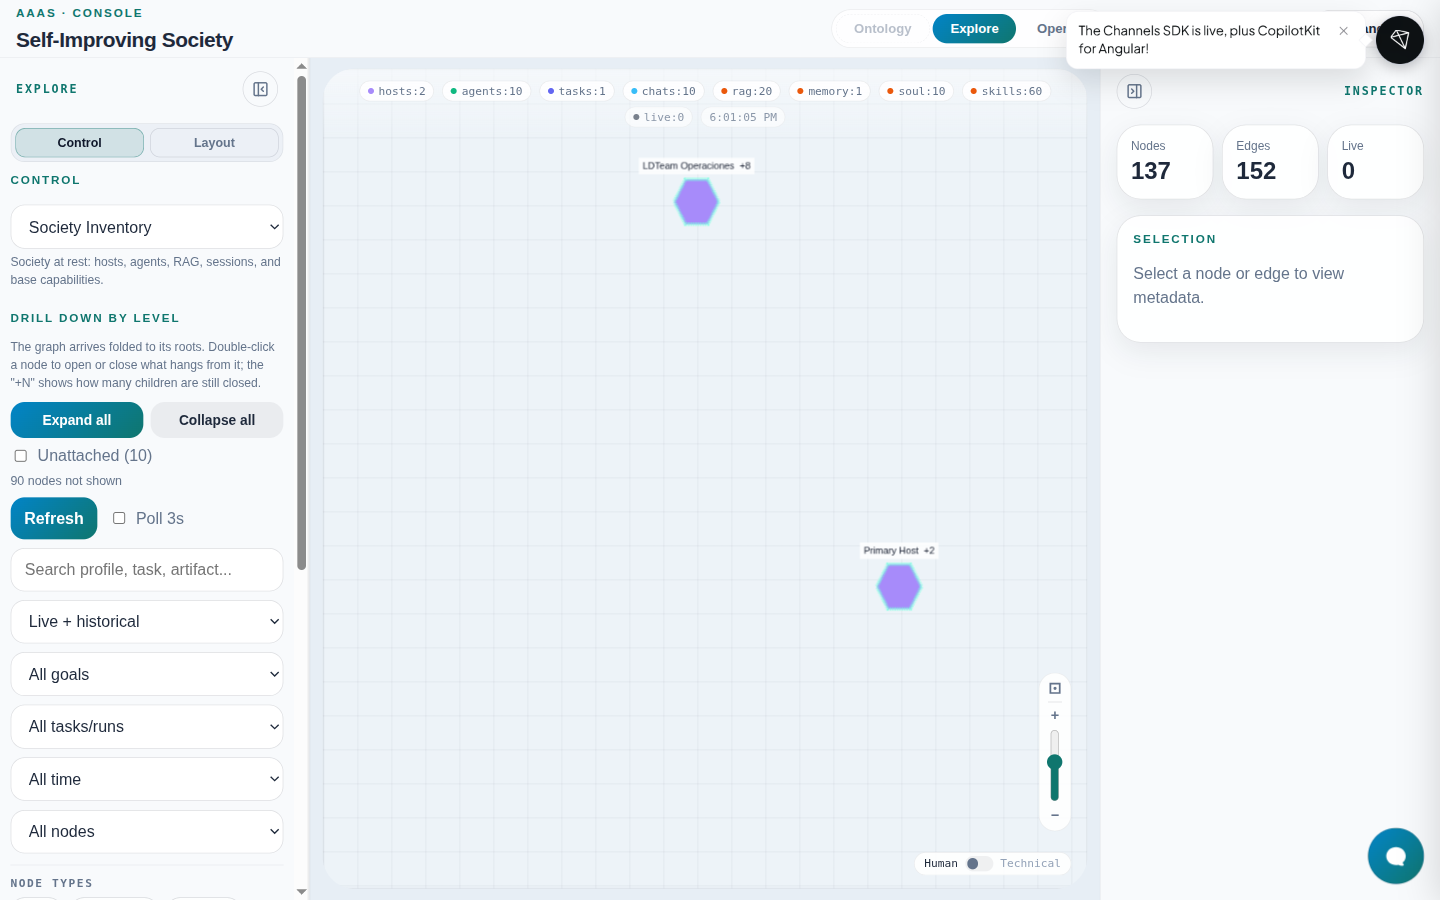
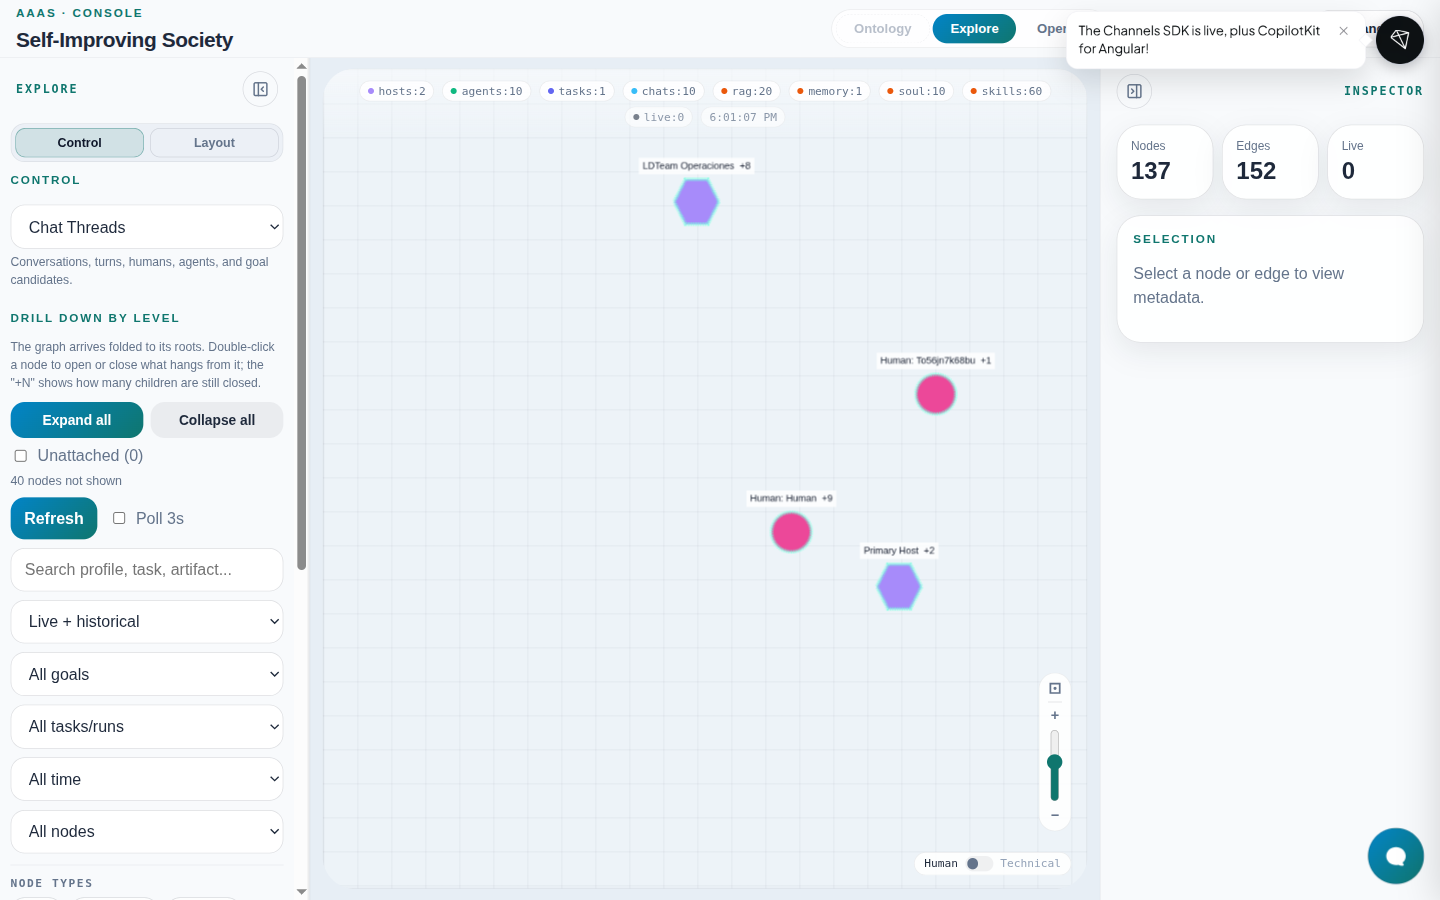
Federated (coming soon): disabled option in the selector; today the snapshot is for the active institution.
Level drill-down
The graph arrives folded at its roots:
- Double-click a node → expand or collapse children;
+Nbadge = hidden children. - Expand all / Collapse all — bulk shortcuts.
- Unattached (N) — nodes without an edge to the main component.
- «N nodes not shown» — active drill-down or hidden by filters.
Filters and search
| Control | Effect |
|---|---|
| Refresh | Manual snapshot reload |
| Poll 3s | Auto-refresh every 3 seconds |
| Search | Filter by profile, task, artifact… |
| Live + historical / Live only / Historical only | Edge temporality filter |
| Goals / Tasks | Scope to one goal or task |
| Time window | Last 15 min … last week |
| Top K | Top 25/50/100 nodes by activity |
| Node / edge / status types | Taxonomy family checkboxes |
| Clear filters | Restore defaults |
Left panel — Layout tab
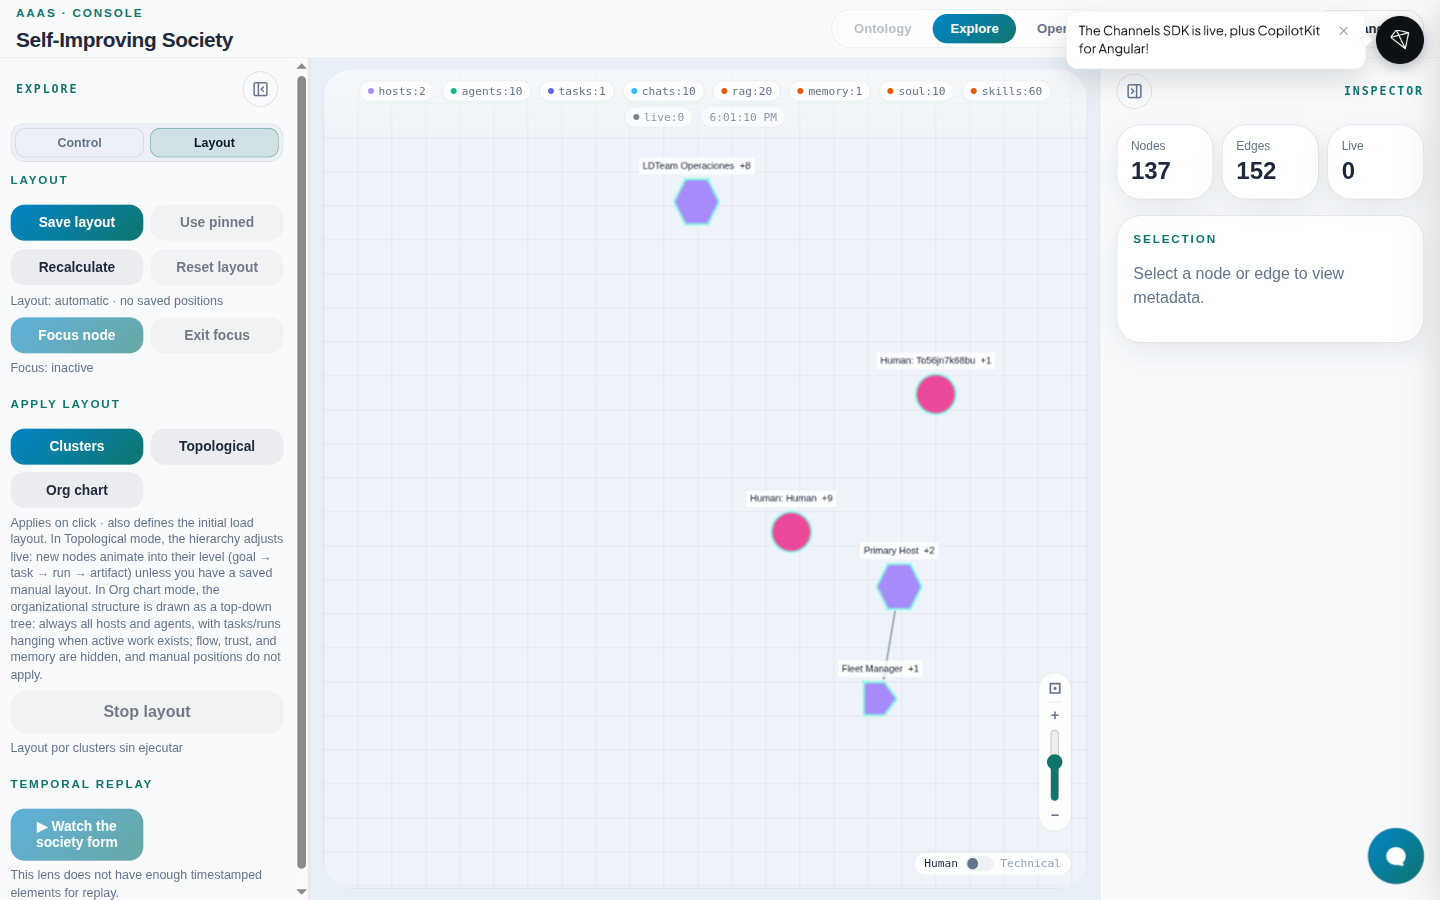
Defines how nodes are arranged (not which data is included):
| Action | Use |
|---|---|
| Save layout / Use pinned | Persists positions in browser localStorage |
| Recalculate / Reset layout | Back to automatic layout |
| Focus node / Exit focus | Semantic zoom to a chosen node |
| Clusters | Community detection grouping |
| Topological | Live execution hierarchy |
| Org chart | Top-down organizational tree |
| Temporal replay | Rebuild graph by timestamp range |
Canvas and labels
- Zoom —
+/−bottom-right; mouse wheel. - Fit — framing icon next to zoom.
- Human / Technical — readable labels vs technical ids.
Inspector (right panel)
- Click a node or edge on the canvas.
- The Inspector shows kind, type, status, id, SOUL (Raw) link when applicable, and metadata.
Causal lens
With a node selected in Explore, enable the causal lens (banner over the canvas):
- Backward / forward / both from the root node.
- Exit restores the full snapshot.
Integrated copilot
The teal bubble bottom-right opens the Console copilot (same OIDC session). It reads the current snapshot and can navigate Operate views. See Chat — Widget.
Troubleshooting
| Symptom | Likely cause | Fix |
|---|---|---|
| 401 Unauthorized banner / empty graph | Expired OIDC session or missing institution:read | Sign out, re-enter via localhost:8093 (not 127.0.0.1) |
| Empty graph (0 nodes) | No live hosts or events | Provision a preset (Provisioning) |
| Ontology inert | No dev:write or local ontology catalog not deployed | Ontology |
| Unknown types in warnings | Emitter outside closed vocabulary | Fix telemetry or extend SiS ontology in repo |